How I set up my server
As time has passed I've grown more and more comfortable developing applications. I've formulated my own opinions about architecture, design patterns, packages, testing, etc. I finally feel like I have a fairly decent grasp on developing modern php applications.
However, I've recently come to the realization that I, as a web application developer, lack skills in one huge area. That area would be server management. This is my brain dump of opinions, what I've learned, and tools I've found that have made me much more confident when working with servers.
In the beginning
As a Vagrant noob at the time, I was thrilled to death when sites like PuPHPet popped up. I could just use a web GUI to pick out the pieces of my stack and voilà, my stack is up and running in VM that emulates my production box. It was awesome....until I needed to tweak something. Then I was back where I started, scared of the command line and unsure of how to accomplish what I needed to. That was a bit of a problem.
According to the internets, I needed to learn how to use a provisioning tool like Puppet, Chef, Ansible, Salt, etc. This was how real developers got things done on their server! After mucking around with Puppet(and hating my life) I was so frustrated. Puppet is hard. I wasn't getting anywhere and I wasting time attempting to learn this tool while I could be developing.
My provisioning revelation
I finally came to the conclusion that I was trying to run before I could even crawl. I needed to figure out how to do things on the server manually via the command line before I attempt to use a provisioning tool, which abstracts that away.
That's about the time I found Servers for Hackers and Vaprobash. Servers for Hackers is an email newsletter/blog/book for developers to get more familiar with their servers. Vaprobash is a set of provisiong shell scripts to use with Vagrant to set up a VM. No fancy provisiong tool here. It is such a good resource to look over to see how to install and configure things by hand. @fideloper is doing an awesome job with both of those. Thanks Chris!
Poring over both of those was such a gigantic leap forward in making me feel comfortable in the command line. I would use Vagrant to get a fresh VM up with nothing installed. I would then reference Vaprobash and other resources I found to install and configure software from the command line. If I screwed something up beyond repair I wasn't worried at all. I'd just destroy the VM and start over. I learned SO much from doing that.
I got to the point where installing and configuring Nginx, PHP-FPM, Postgres, Redis, etc wasn't a big deal. Yes, it took some hours getting familiar with them but I now know exactly how to work with them. I was able to get a real server up and running on DigitalOcean. I even learned how to use both Capifony and Rocketeer to deploy my code.
Reliability with Monit
You'd think at this point I'd be feeling pretty damn good. Well, I did and I didn't. What happens if any of my services decide to stop? I'd be in a bit of a pickle if nginx just stopped or my php-fpm got killed. The other part of that insecurity was wondering how I would know if one of those services stopped? Getting emails from my app's users didn't sit well with me at all.
After doing a bit of searching I came across Monit. Monit is a "utility for managing and monitoring Unix systems". It's exactly what I needed to ease my nerves. It will sit there and poll services every so often and determine if the service is running or not. If it isn't, it will attempt to restart the service automatically. It was also dead simple to install and start monitoring services. I set it up to monitor nginx, php-fpm, postgres, and redis. You can even configure it to send you email notifications when services stop, successful restarts, pid's of services change, and more. I referenced this page and configured it to use my mailgun account to send me emails. I felt so much more at ease after learning about and using Monit.
Here's how simple Monit is to configure. This keeps nginx running.
# /etc/monit/conf.d/nginx.conf

check process nginx with pidfile /var/run/nginx.pid
    start program = "/etc/init.d/nginx start"
    stop program = "/etc/init.d/nginx stop"
There's a ton of examples illustrating how to get started monitoring various services.
monit status command you need to have configured the web service. You can just set the "use address" and "allow" address to "localhost". See this gist.
Visualizing health with Graphite and StatsD
Everything was running smoothly at that point in time but I still had no idea how to monitor the health of my server and application. I didn't even know what "healthy" meant. How much RAM and CPU usage is normal? How close are my disks to being filled up? How much memory is php using in a typical http request?
I needed a way to keep keep track of these things. Luckily, I aleady knew about Graphite and StatsD. Graphite is a python web application. You can send it any kind of stat or metric you can thank of over http, it will store it, and then you can visualize those stats by building graphs. Graphite is also incredibly cool because you don't need to do any set up for each statistic you want to send. You just start sending that stat and you're good to go. There's no configuration on a per stat basis.
Instead of sending stats directly to graphite, you can send them via UDP to StatsD, a nodejs daemon built by the folks at Etsy. Because of the nature of UDP, when your web application sends stats to your StatsD daemon, it doesn't wait for a result. This is fantastic. It means you can send as many stats and track as many things as you want without worrying about your code slowing down. It's brilliant.
After becoming comfortable in the command line I came up with a provisioning script to install Graphite and StatsD in local VM to play around with a while ago. However, trying to follow the same steps on a newer flavor linux lead to a miserable failure. Luckily I found a guide on installing Graphite and StatsD on the version of linux I was using(14.04). Following it was so much easier than what I went through when I was coming up with my provisioning script.
I got it all this up on a a 512Mb DigitalOcean droplet and I was using Monit to ensure the required services stayed up...except they weren't. I found that some services kept dying because they were running out of RAM. I had been meaning to learn how to use DigitalOcean's snapshots and this was a perfect time. I created a 1G droplet and have been good ever since. Spending $10/month to be able to track statistics for all of my projects is money well spent in my opinion.
Collecting stasts with collectd
In the Graphite installation guide you'll notice a section on collectd. Collectd is a daemon that will collect metrics from your server every so often. You install this on your application server. With the plugins that it came installed with, I configured it to gather the following stats: RAM usage, CPU usage, disk space, nginx load, and system load. I also made use of the postgres plugin to query my database to report the counts of certain tables. I'm reporting how many users and other of records specific to my application exist. It comes with a plugin for Graphite. You just tell it the ip, port, and a few other settings and just like that I was reporting the health of my server.
I ran into a few issues when i was configuring collectd though. When reporting on disk size i needed to figure out which drives I had available. I used the df command to see that i had a /dev/vda drive. I configured the plugin according to the docs but wasn't getting any stats. It took me a while to figure out that I had configured it for the wrong type of drive. I had specified "ext3" when it should have been "ext4". You can use the blkid command to show what kind of drive you have. Ie. blkid /dev/vda
The other issue I ran into was trying to configure the postgres plugin to gather count metrics for my tables. I finally fooled around with it long enough and figured out I needed to be using the "gauge" metric type in the plugin.
# /etc/collectd/collectd.conf

# other plugin configuration...

<Plugin postgresql>
    <Query users>
        Statement "SELECT count(*) as count from users;"
        <Result>
            Type gauge
            InstancePrefix "users"
            ValuesFrom "count"
        </Result>
    </Query>
    <Database your_database_name>
        Host "localhost"
        Port 5432
        User "your_database_user"
        Password "your_database_password"

        SSLMode "prefer"

        Query users
    </Database>
</Plugin>
You can define as many Query blocks as you want, just remember to reference them in the Database block. You can even use several databases. All you need to do is define another Database block.
Because collectd is constantly sending stats to my Graphite instance I can create graphs to visualize how how my server is performing over time. I now have a baseline. I now know what "healthy" means. If graphs start spiking I know there's a problem. I can also pat myself on the back when I see my database counts are growing because that means people are using my app! :)
Slick graphs with Grafana
So hopefully I've sold you on Graphite but it gets even better. Your graphs can be even slicker. Allow me to introduce you to Grafana, an AngularJS frontend for Graphite. You can define your graphs in Grafana and it will use your Graphite's REST api to gather metrics to render graphs. It stores your graph definitions in elasticsearch. That's the only requirement that Grafana has aside from a web server and a Graphite to get data from.
I've created two dashboards so far. One to visualize the health of my server and one for seeing the activity of my application. They're glorious.
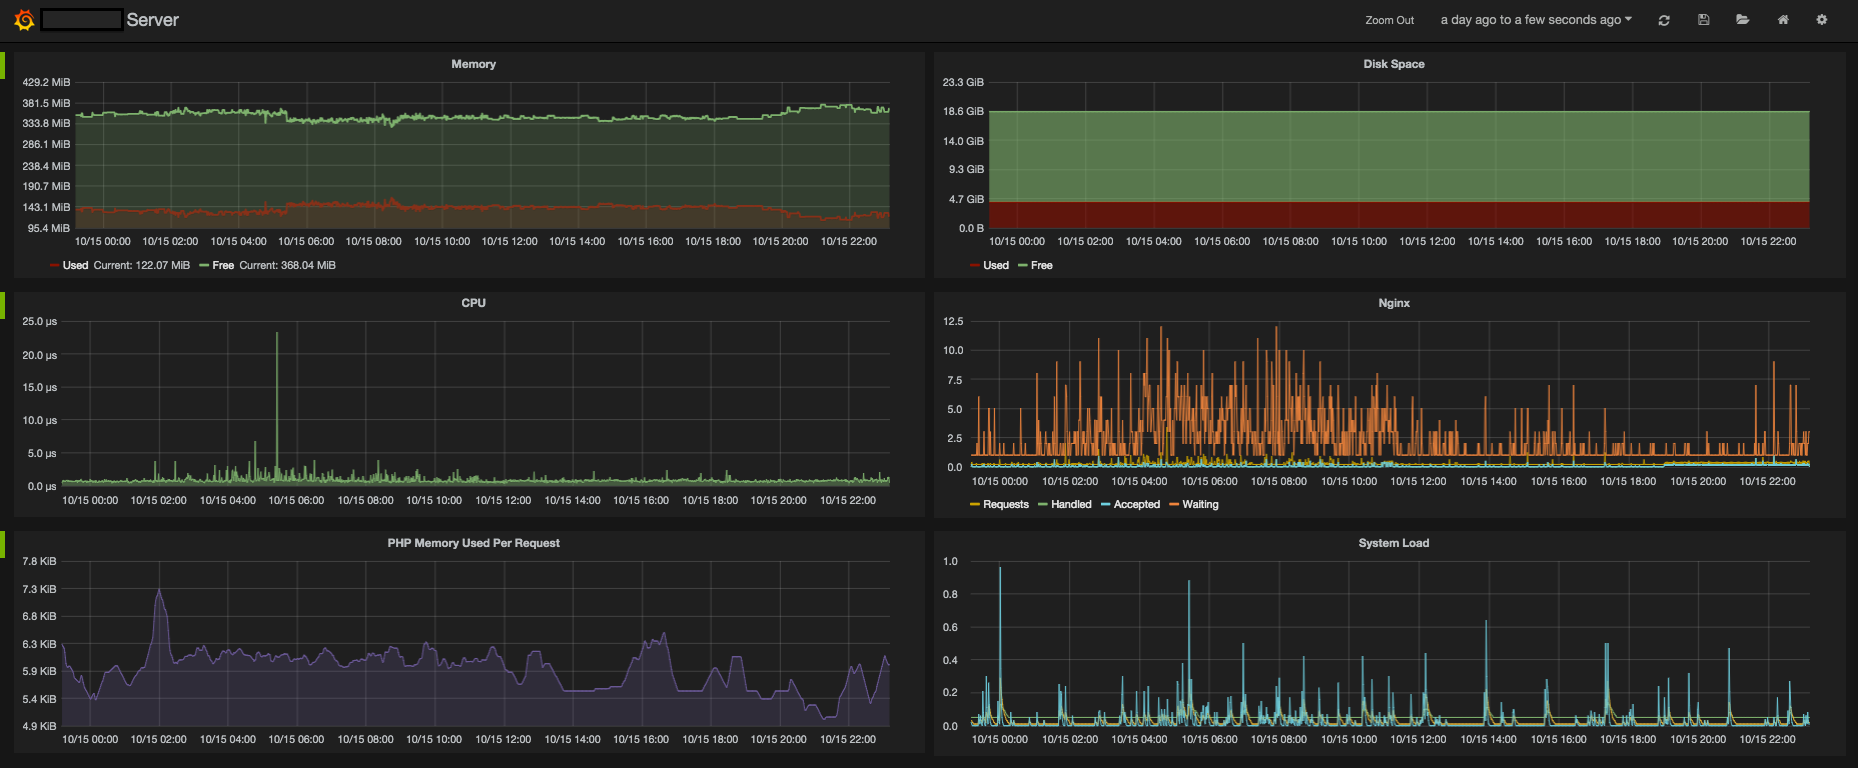
I'm tracking RAM, CPU, Disk Space, Nginx requests, php-fpm memory used per request, and system load.
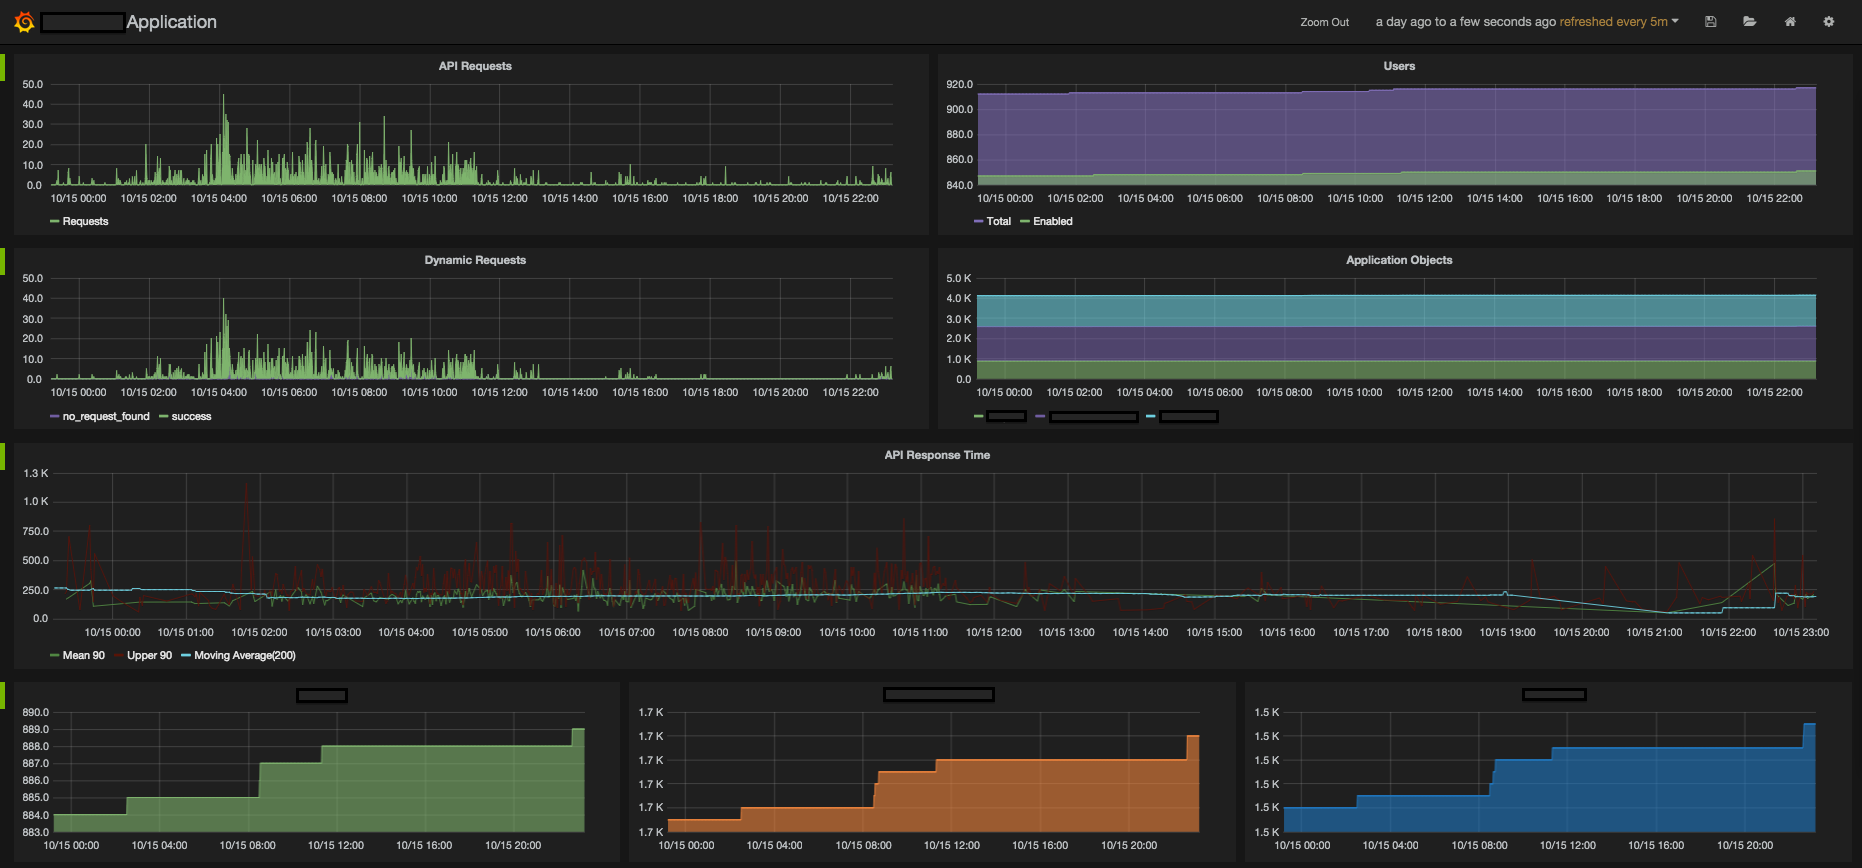
In my application dashboard, I'm tracking how many requests my app is getting, user count, response time for each request, counts of other of my application database records. Although it's not depicted in the images above, I'm also sending a "release" stat in my deployment process. Once I graph those as vertical lines I'll be able to tell if a release had performance impacts.
Regular database backups to S3
The last bit of assurance I'll touch on is database backups. I've signed up for a free Amazon Web Services account to use S3 for free storage. I installed the aws command line tool and am using it in a cron job to back up my database nightly. Here's the contents up my backup shell script.
#!/usr/bin/env bash

# /root/scripts/cron/backup_database.sh

# remember to chmod 755 this script

# dump database to the postrgres user's home directory
sudo -u postgres pg_dump my_database_name > /var/lib/postgresql/my_database_name.sql

# send to s3
aws s3 cp /var/lib/postgresql/my_database_name.sql s3://myappname/backups/my_database_name.sql

# let me know by sending a stat
echo "myapp.db.backup:1|c" | nc -u -w0 {my-statsd-ip} {my-statsd-port}
I then added this bit to my crontab.
# /etc/crontab

# other entries...

30 2 * * * root . /root/.bash_profile; /root/scripts/cron/backup_database.sh > /dev/null 2>&1
So what's happening here? The first part, 30 2 * * *, specifies when to run the script should run. This will run the shell script every night at 2:30 am. The second part, root, specifies which user the script should run as. The next bit, . /root/.bash_profile;, basically says to use that file for environment variables. When installing the aws cli tool, I put my aws key id and secret in that file and exported them so they would be available to the root user. The next part is the actual script to run. The last part, > /dev/null 2>&1, specifies where the output of the script should go. This just sends the output into a black hole because there is no output and I wouldn't care about it even if there was any.
That's all!
That wraps it up so far! I feel like I've come such a long way when it comes to server admin stuff. I'm much more confident in my web applications staying alive. The tools I've learned about are incredibly cool and useful. I hope you've learned a bit and if not maybe you have some tips for me. I'd love to hear them!
Categories: Servers
